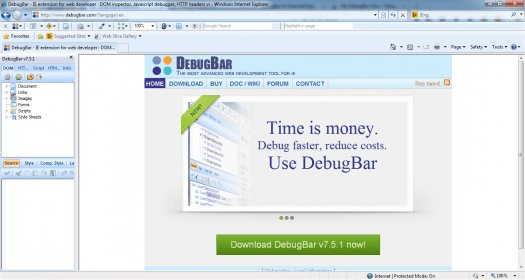
DebugBar for Internet Explorer is a utility for advanced web developers. It is somewhat similar to ' Firebug ' plugin that comes with Mozilla Firefox. As the name says Debugbar helps you to debug & display underlying information of a web page. It shows all the information related to CSS, JS, HTML used in a web page or application. This information helps you to create more tighter & efficient code. This small plugin comes with a very nice feature set which can only be find in a paid software. It has a inbuilt DOM Inspector which allows you to view DOM Tree and modify tags attributes and css attributes on the fly to test your page, then there is a HTTP Inspector which allows you to View HTTP/S request to check cookies, GET and POST parameters, view server info. A Javascript Inspector and Javascript Console is also there, with the help of which you can view javascript functions for easier debugging, & an HTML Validator that helps you to validate your web page. There are more features which you can know only after using this plugin
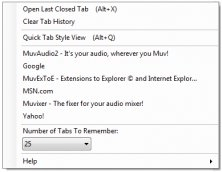
Comes in handy for users who work with Google search on a daily basis.


Comments